Benefits of Real-Time Data Visualization

Real-time data visualization is a key strategy to ensure safety, efficiency, and productivity
Environmental monitoring in commercial and industrial spaces is crucial to ensure regulatory compliance, occupant safety, energy efficiency, and productivity.
This type of monitoring benefits from technological advances in sensing, visualization, and data processing, working together with the IoT to revolutionize flawless environmental variable management.
In this article, we explore the main advantages that real-time data visualization offers for monitoring variables such as temperature and humidity, among others.
Essential Requirements for Data Collection and Visualization
To efficiently visualize data from each commercial or industrial process, it is first necessary to ensure that the entire data collection system is the most suitable.
Monitoring environmental variables starts with implementing a system tailored to the specific application and capable of wireless transmission. This simplifies the process and lays the foundation for a high-performance monitoring network.
It's also crucial that the monitoring system can integrate with data visualization platforms or solutions.
The automatic recording and transmission of data, such as relative humidity and CO2 levels, to these platforms at any given time, is a game-changer for users and process managers.
The final requirement to consider lies in the system’s features, particularly the ability to send alerts or notifications when errors or data collection deviations are detected, or if any intervention is required.
Only by combining all these aspects can real-time data visualization deliver its full benefits.
List of Benefits
Below, we outline the most notable advantages experienced by companies that choose to access real-time visualizations of the environmental data from their spaces.
Faster Response and Increased Agility
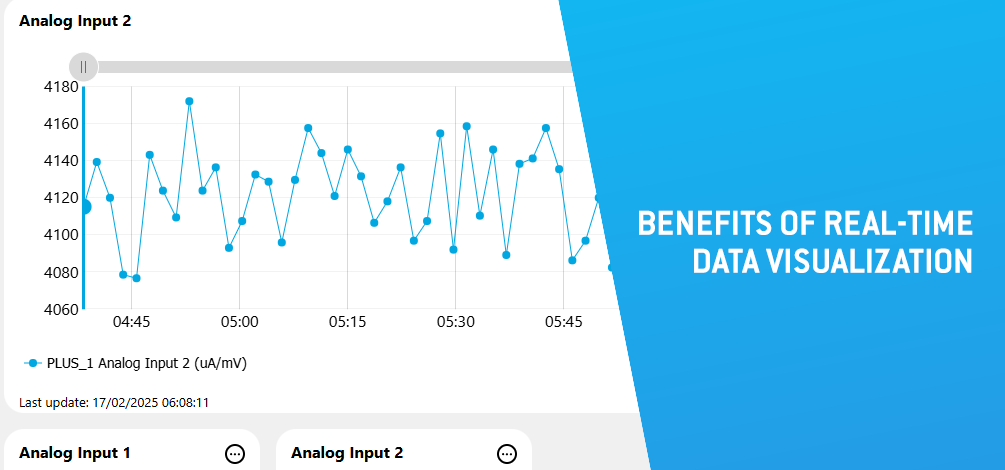
The immediate transformation of isolated numerical data into graphical representations and automatic notifications ensures a quick response to control variables.
When a deviation is detected (e.g., temperature rising above 5°C), managers can act immediately, mitigating productivity losses, product spoilage, or harm to human wellbeing within their organizations.
This is the best solution for detecting anomalies and implementing an effective intervention approach in the monitored applications.
Regulatory Compliance and Documentation
Applications requiring compliance with strict regulations are numerous and growing. Two major examples regarding temperature and humidity levels are food retail stores and pharmacies.
With real-time data visualization solutions, it's possible to set thresholds and reference values for key indicators. This approach adds transparency and compliance to each business process.
In addition, real-time data visualization and analysis tools generate automatic reports and allow the export of historical data.
This makes it easier to assess patterns based on past events and demonstrate regulatory compliance to auditing authorities.

Improved Comfort and Wellbeing
Immediate evaluation of recorded values for various variables, like carbon dioxide, is essential for maintaining optimal conditions in enclosed environments.
Real-time indoor monitoring enables timely adjustments, for instance, to heating, ventilation, and air conditioning systems.
Besides optimizing conditions and showing a commitment to occupant health, this benefit is even greater when the monitoring system spans multiple rooms or different areas.
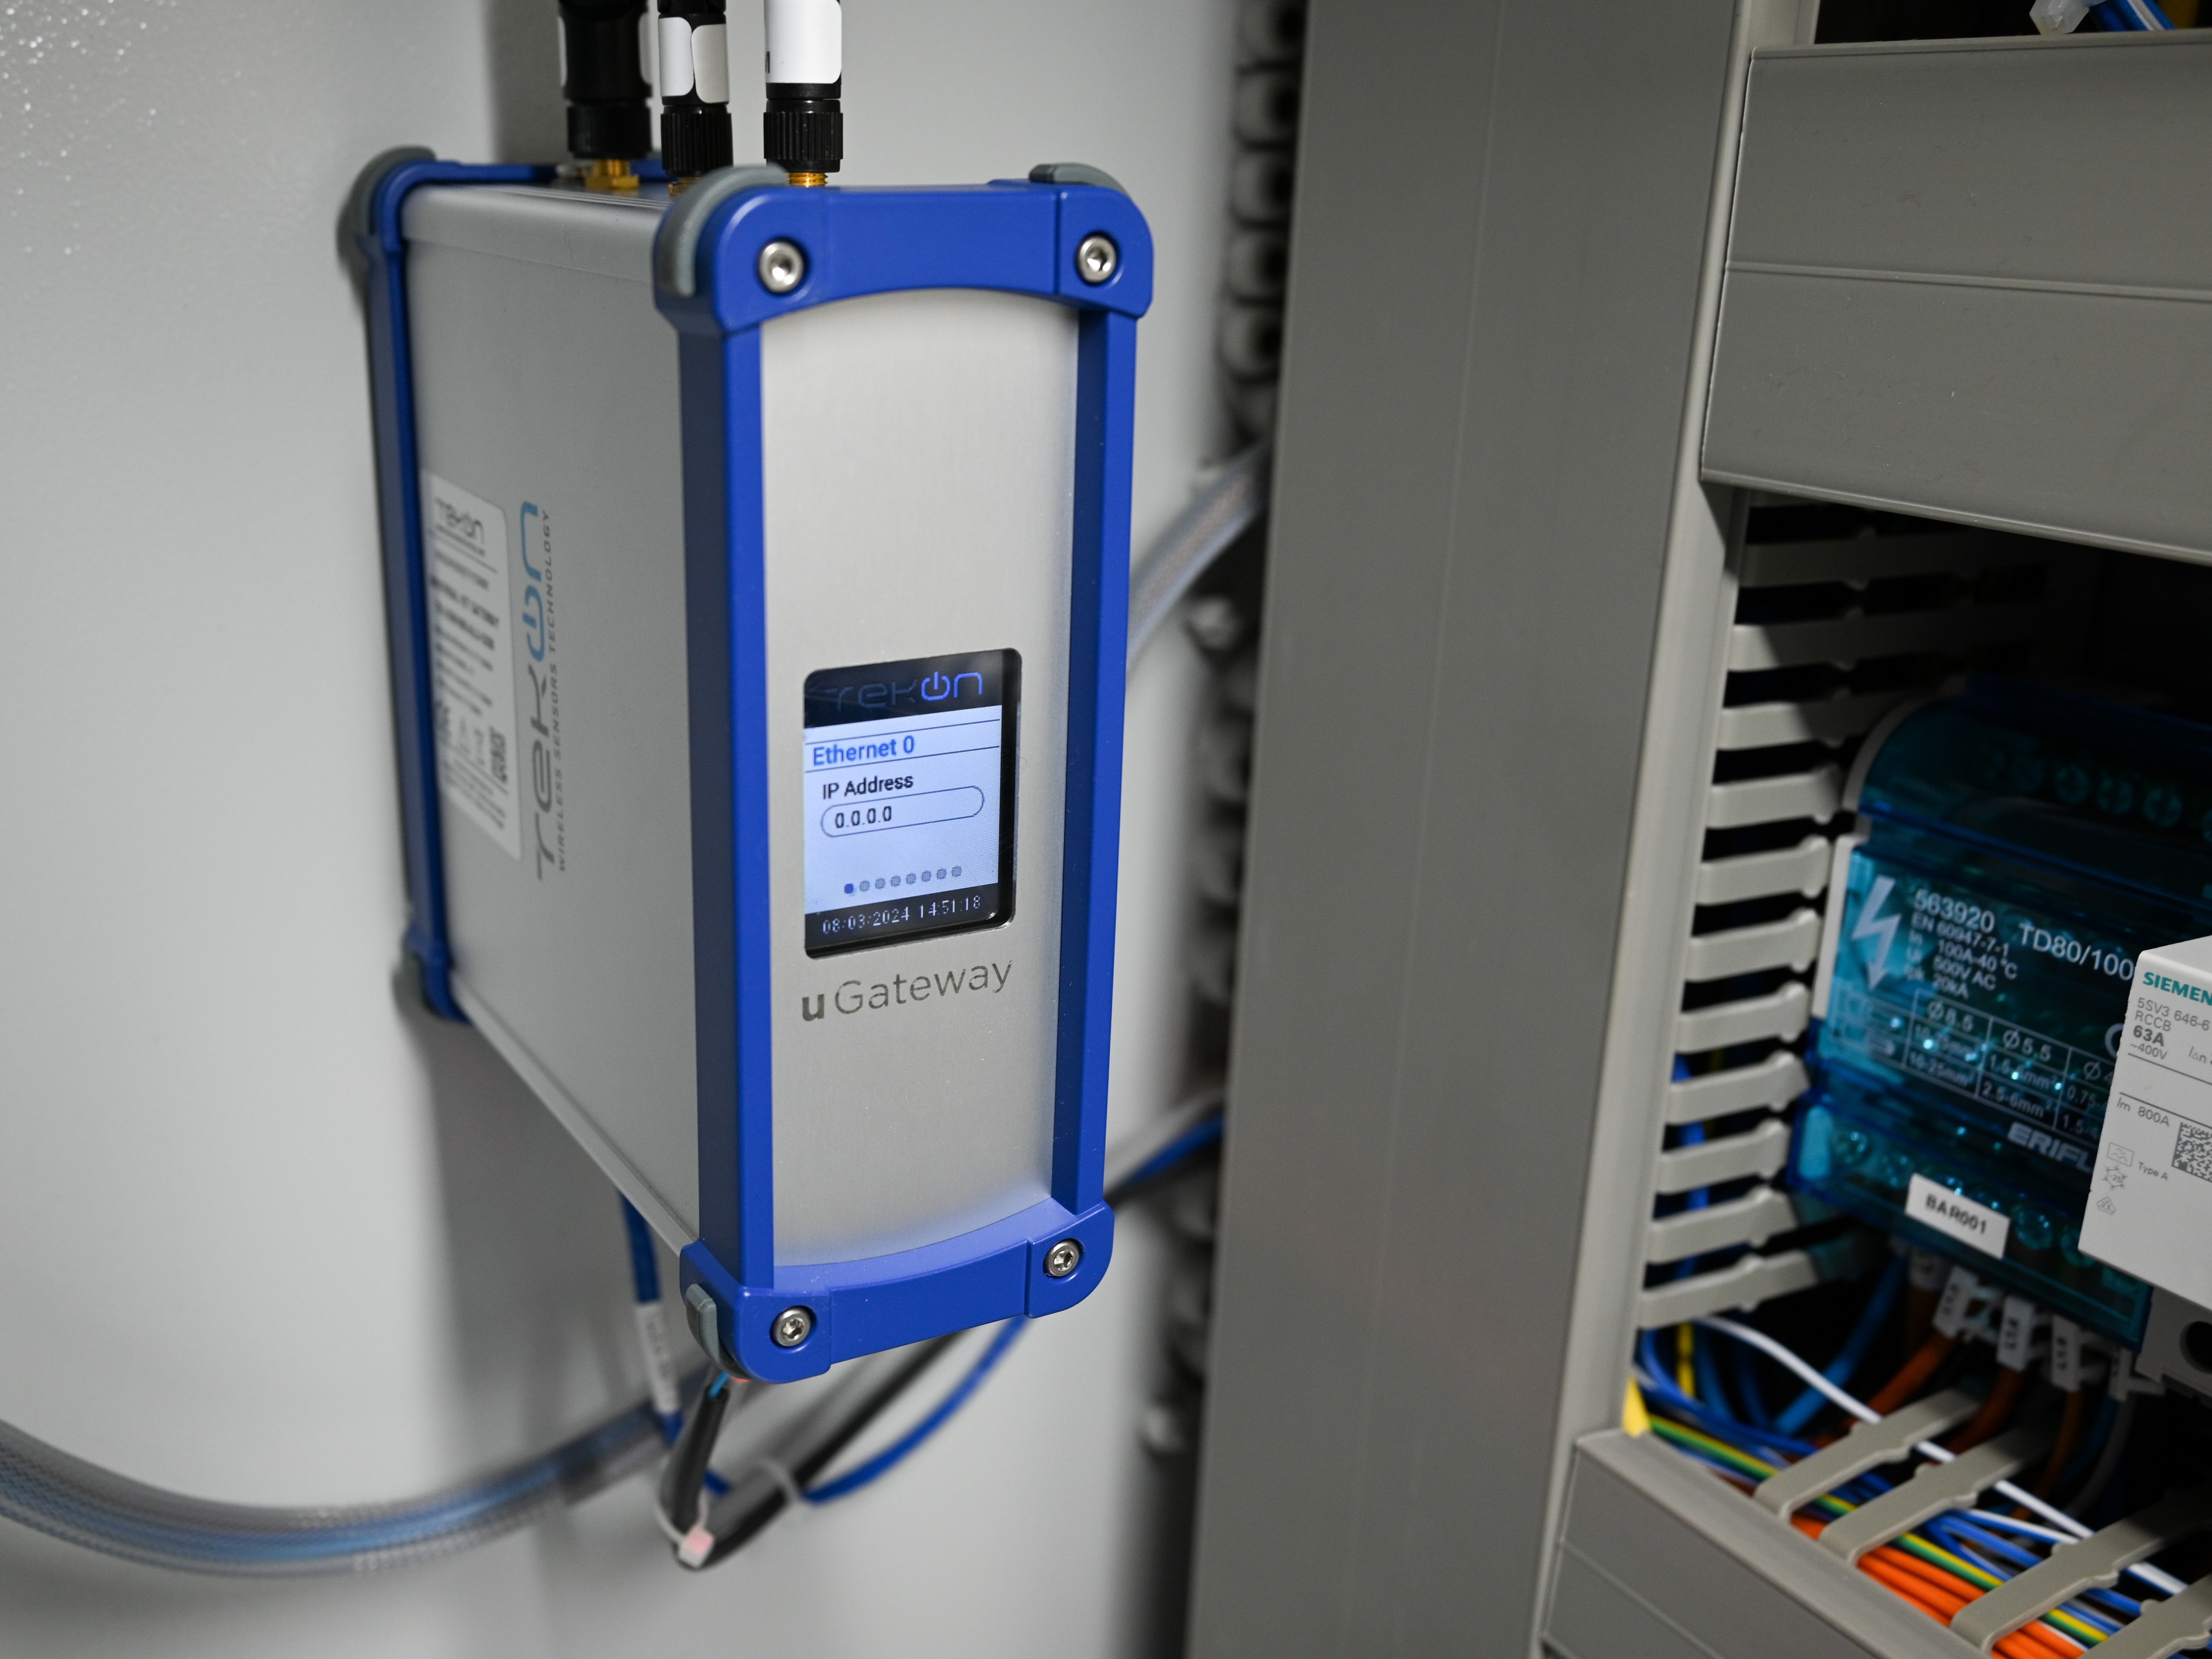
In such cases, different thresholds and reference values are set for each space, but all transmitters are connected to a centralized solution like the Universal IoT Gateway.
Cost Reduction
Switching from a reactive approach to a predictive maintenance strategy helps detect faults and deviations early, reducing negative impacts on organizations.
This strategy, paired with pattern analysis based on historical data and previous automatic reports, boosts operational efficiency and lowers costs.
Another way real-time data visualization helps reduce costs is by extending equipment lifespan. Ensuring optimal environmental conditions and making immediate adjustments helps prevent damage and excessive wear on equipment, particularly in environments like data centers and laboratories.

Given the significant impact these benefits can have across various industrial and commercial settings, it's clear that real-time data visualization is a crucial step for managing the environmental conditions of enclosed spaces.
Proactive action to make this happen means investing in your business's current performance while strengthening its future position.
Visualize and Analyze Data with Tekon Electronics
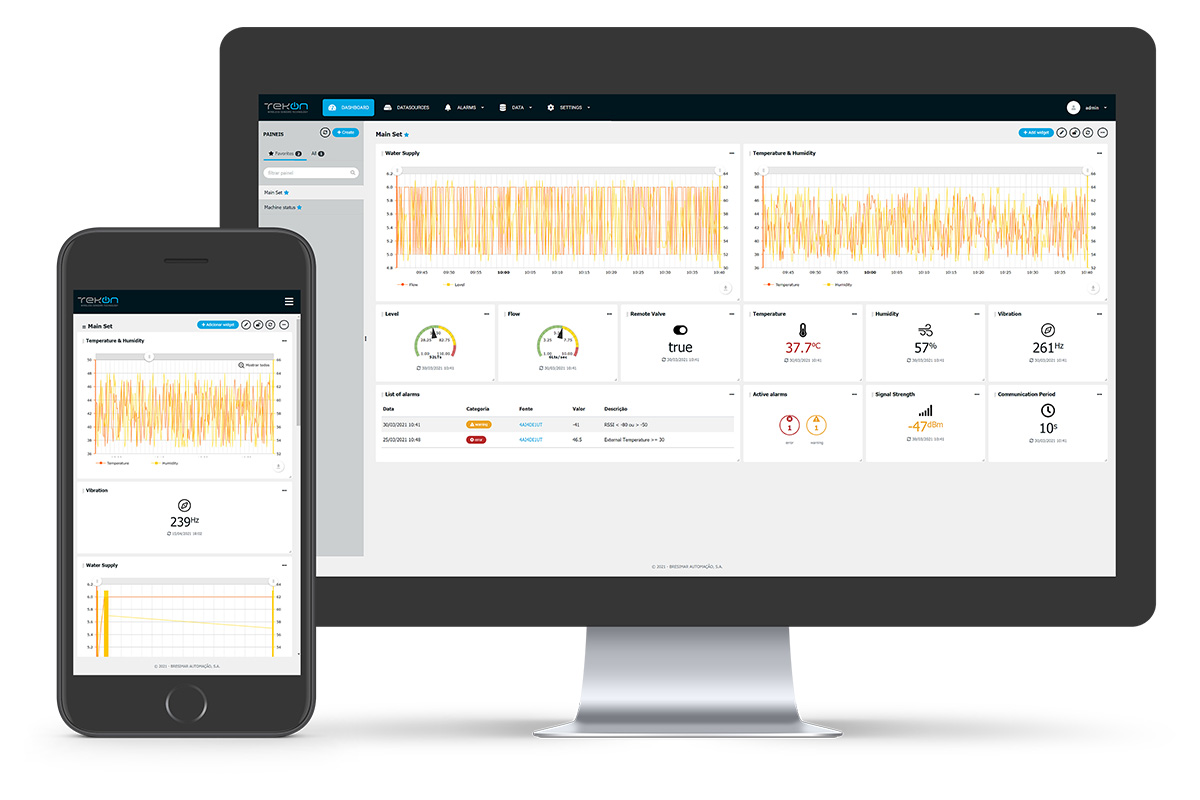
By implementing a complete monitoring system from Tekon Electronics, you ensure access to all the advantages explored in this article, thanks to the vital role of the Tekon IoT Platform software.
Integration with smart transmitters and sensors, along with the scalability and flexibility that define this platform, are essential for making decisions based on real data.
Choose the Tekon IoT Platform to benefit from an easy-to-use interface and enhance your processes!
Try the software now through THIS LINK.
Login details
User: demo
Password: demo1234!